In my years as a plant-floor engineer, I’ve witnessed the inner workings of pharmaceuticals, medical devices, and other regulated manufacturing operations. Before my career shift towards quality, regulatory compliance, and risk management, I was deeply involved in improving manufacturing operations and efficiency. From developing software applications to harmonizing cross-divisional supply chain processes, I’ve navigated the production mindset with a focus on operational efficiency, cost reduction, and customer fulfillment.
However, my journey took a pivotal turn when I began to grasp the profound impact of “unbalanced” operational cultures, now recognized as “Quality Culture.” This realization led me to develop a straightforward yet powerful metric to assess a company’s quality culture, particularly at the plant-floor level. I’ve referred to this measure extensively with clients and discussed quality culture in regulated manufacturing settings. It’s an easy-to-understand, easy-to-measure, and challenging-to-dispute concept that can lead to positive change.
The Two-Data-Point Measure of Manufacturing Quality Culture
The Two-Data-Point Measure of Manufacturing Quality Culture is a metric that quantifies the average time spent by management, leadership, and supervision, discussing two key aspects:
- Production Topics: This includes conversations about efficiency, cost reduction, production targets, scrap costs, turnaround time, and a focus on speed.
- Quality Topics: These discussions revolve around quality policies, compliance with procedures, safety, industrial hygiene, environmental improvements, achieving right-first-time quality, training, compliance metrics, and more.
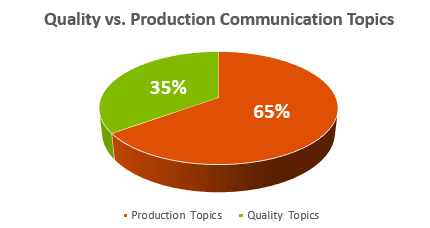
To gauge this measure, I’ve interviewed plant-floor personnel, including manufacturing, production, quality, and logistics/warehousing personnel. I ask them to imagine a pie chart where the first data point represents Production Topics, and the second data point represents Quality Topics, expressed as percentages (e.g., 50% – 50%, 60% – 40%, etc.).
Consistency and Insights
Remarkably, the data has remained consistently skewed toward Production Topics across multiple plants and companies over the years. In no facility has more time been spent discussing Quality Topics than Production Topics. With the Production Topics data point ranging from just above 50% to nearly 95%, this pattern sheds light on a pervasive issue in our industry: an imbalanced Quality Culture.
Example Chart:
Addressing Criticisms and Moving Forward
Critics may question the measure’s subjectivity, lack of objective data, and potential for leading questions. To address these valid concerns, we’ve developed a more scientific tool – the Quality Culture Behavioral Assessment Model, offering calibrated, in-depth cultural assessments.
However, for many, this two-data-point measure provides quick and meaningful insights into their organization’s culture. Sometimes, simplicity is vital. Regardless of the tool’s sophistication, measuring manufacturing quality culture is possible, even if it’s approximate and directional.
Take Action
I challenge readers to try this measure in their organizations. Talk to your team members, gather informal data, and create charts. You may be surprised by the results. Remember, it’s a cost-effective way to gain valuable insights into your company’s culture.
For more information on the Two-Data-Point Quality Culture Measure or the Quality Culture Behavioral Assessment Model or to improve your organization’s quality and compliance culture, please get in touch with us below.
Contact Form
"*" indicates required fields
FAQs For Quality Culture in Manufacturing
Quality Culture in Manufacturing refers to an organization’s workforce’s collective values, beliefs, attitudes, and behaviors, which influence the quality and compliance standards upheld throughout the manufacturing process.
Quality Culture is crucial because it directly impacts product quality, safety, compliance with regulations, and customer satisfaction. It also fosters a culture of continuous improvement.
Building a robust Quality Culture involves leadership commitment, employee engagement, practical training, clear quality policies, open communication, and a focus on continuous improvement.
Common challenges include resistance to change, lack of leadership support, insufficient training, communication gaps, and competing priorities.
Leadership sets the tone for Quality Culture by demonstrating a commitment to quality, establishing clear expectations, and providing necessary resources and support.
Employees contribute by adhering to quality standards, reporting issues, participating in training, suggesting improvements, and embracing a culture of accountability.
Key elements include a focus on product quality, compliance with regulations, safety, risk management, continuous improvement, and a customer-centric approach.
A robust Quality Culture can enhance productivity and efficiency by reducing errors, minimizing rework, optimizing processes, and streamlining operations.
Signs include a proactive approach to quality issues, a culture of problem-solving, high employee morale, low defect rates, and a commitment to exceeding customer expectations.
Quality Culture can be measured through surveys, interviews, key performance indicators (KPIs), and the Two-Data-Point Measure of Manufacturing Quality Culture.
Yes, Quality Culture can be improved through training, leadership development, continuous feedback, and a commitment to addressing weaknesses and areas for improvement.
Poor Quality Culture can lead to compliance violations; product recalls, customer dissatisfaction, increased costs, damaged reputation, and legal issues.
A robust Quality Culture facilitates regulatory compliance by promoting adherence to procedures, documentation, and a commitment to meeting regulatory requirements.
Different industries may have unique quality and compliance requirements so Quality Culture strategies may vary accordingly.
Organizations can seek guidance from industry associations, consultants, training programs, and regulatory agencies for resources and best practices in enhancing Quality Culture.